Reporting from Prod
I was doing some load testing for a new set of reports recently. Unfortunately the requirement for the reports was real-time data from the Great Plains ( Microsoft Dynamics) database. Unfortunate, because you as a SQL DBA/Dev already know that any queries on a database can cause locks at various levels and that in turn will likely impact the main Dynamics application and those people using it.
On the other hand, the built-in reports within Dynamic, or FRX extension don’t cover all the requirements of the business, and the business must always come first. I hope they are teaching you that right? You are there to support them!
So what do you do? Optimise the queries, make sure indexes are being used, check all the execution plans to make sure there’s nothing obvious that can be optimised.
Load testing on Test
So that’s all done, now to do some realistic testing. Obviously testing doesn’t get done on production box so you simulate an environment as close to production as possible.
One the one hand you should also be running the Dynamics (or whatever front end applications you have in production) application on the same box because systems theory tells you that interactions are complex and testing in isolation doesn’t account for those effects.
On the other hand, it’s a fair test and easier to set up the filtering in SQL Profiler with fewer services hitting the database.
So with that said I proceeded with a 10 user load test with users hammering the reports for a 15 minute session. 200 gig database refresh was only a few days old, however, it’s important to test with fresh data where possible but you still have to make sure the business people involved in testing are aware that the test data is not live and will not reflect their recent work. Otherwise they will just get hung up on the data being wrong.
Anonymising the Data
Others have spoken at length about altering the data to make it non-sensitive, i.e. anonymising the data, however, this is an internal only set of reports and the testers are the same people who will be the eventual users, so I think it would be counter-productive to mangle the data. Not to mention that anonymous data often isn’t. It certainly applies if you are outsourcing your testing or otherwise compromising security, but in that case it’s not enough to simply remove identifiers, you need to mangle them into jumbles of letters or numbers. Harder than it sounds, better of reading other articles about that.
Profiling
Starting up the profiler, I go straight for the Events selection, and only leave the Sessions – existing connections, Stored Procedures – RPC:Completed and TSQL SQL:BatchCompleted events ticked. Knowing when events start is all well and good for detailed analysis but it leaves you with two rows for the same event and for this purpose I want to just generate a single row for each event.
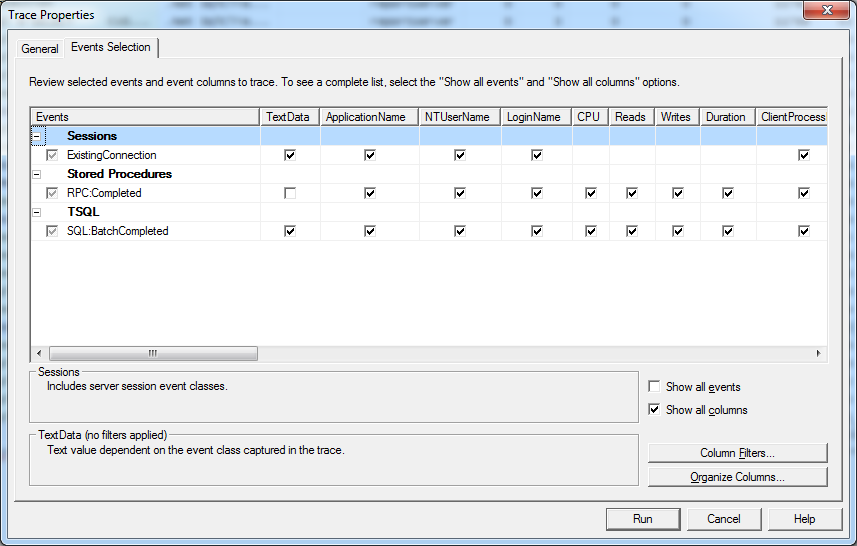
After that it’s useful to change some Column Filters using that button on the bottom right of the Events Selection screen.
DatabaseName, and LoginName specifically, because I don’t want to capture myself (only the testing users / report server user depending on how your reports connect to the source DB) and I only want to target the particular database instance that the reports are sourcing data from.
So you can see in this shot I’ve set the DatabaseName filter to be Like Dynamics (assuming your database is called Dynamics. Note mine was not, I just changed it for this write up).

Then it’s on to running the trace.
It’s kind of fun to watch this, especially where you have parameterized queries where you can clearly see usernames or other identifiers show up in the running queries.
It can also be useful to enable a trace stop time, and start the testing at exactly a certain time. E.g. I started at exactly 3pm and set the trace stop time for 3:15pm exactly. This gave me 15 minutes of query data.
I then saved the trace into a table. I recommend saving to a table because then you can run queries on it. Note that as long as you have permission to create tables (with the username you are using to run the profiler) that the table will be autocreated and inserted for you. Nice.
So I saved the data to a table called ‘TraceTable’ on the same test database. Why not put it there since I’m going to drop that DB later anyway.
Querying the results
A rough query such as this example can be used to analyse the results:
Declare @NoOfCPU Decimal (4,2)
Set @NoOfCPU = 4.00
SELECT
15.00 as Total_Trace_Time_Mins,
60.00 as Total_CPU_Time_Available_4_Threads,
(Sum(CPU)/ 60000.00)/@NoOfCPU as Total_CPU_Mins_4_Threads,/*CPU is stored in milliseconds, divide by 60000 to get minutes*/
Sum(CPU)/ 60000.00 as Total_CPU_Mins_1_Thread,
((Sum(CPU)/ 60000.00)/4.0 )/15.0 as Total_CPU_Usage_Percent,
Sum(Reads)as Total_Rows_Read,
(Sum(Duration)/ 60000000.00)/@NoOfCPU as Total_Duration_4_Threads,/*Duration is stored in microseconds (as of SQL2005), divide by 60000000 to get minutes*/
Sum(Duration)/ 60000000.00 as Total_Duration_1_Thread,
Avg(CPU)/ 1000.00 as Avg_CPU,Avg(Reads)as Avg_Reads,Avg(Duration)/ 1000000.00 as Avg_Duration
FROM [dbo].[TraceTable]
where
TextData like‘exec sp_executesql%’
Note the comments about how the values are stored.
The difference between duration and CPU is also interesting. CPU is actual CPU time, and duration includes various wait times and I/O times. I would look at both values, i.e. if the duration is 2 and the CPU is 1.5 then I would report a duration of 2.0 with an overhead of 33% inclusive. Both values are important for determining impact on the server.
The queries in this set of reports were all embedded in the SSRS reports, rather than using Stored Procedures. I tend to prefer using Stored Procedures where possible but this particular set of reports but also be managed by a power user who has no database object creation rights (and will never be given them!) so the queries must remain in the reports.
It was interesting to me that SSRS still hands off these queries to the database using the sp_executesql procedure. Probably the SQL injection safe way to do it right?
Summary
Doing a bit of optimising, load testing and profiling is good practice and due diligence in all reporting scenarios but particularly when you are reporting from live production environments and you need to ensure the reports will have a minimal impact on the operation of the front end applications.
A follow up test for this should be to measure baselines on production, and then measure the added impact of the new reports which covers the complex system interactions I hinted at earlier.
Also, Server Side traces are the way to go right? But when I learn how to do those properly I’ll write about it.